The landscape of sports broadcasting has undergone a revolutionary transformation over the past decade, evolving from basic play-by-play commentary to sophisticated analytical coverage that rivals academic research in its depth and precision. Modern viewers no longer accept superficial observations about what happens on the pitch; they demand comprehensive insights into why events unfold, how tactical decisions influence outcomes, and what underlying patterns reveal about team performance. This shift reflects a broader cultural movement towards data-driven understanding across all sectors of society, where audiences possess increasingly sophisticated knowledge and expect coverage that matches their elevated expectations.
Expert analysis has emerged as the cornerstone of this evolution, bridging the gap between raw statistical data and meaningful interpretation that enhances viewer comprehension. The integration of former professional athletes, qualified coaches, and performance analysts into broadcasting teams has created a new standard for sports coverage that goes far beyond traditional commentary. These experts bring unique perspectives shaped by years of professional experience, enabling them to decode complex tactical situations and explain the subtle nuances that casual observers might miss.
Advanced statistical analytics transform match commentary beyond traditional Play-by-Play
The incorporation of advanced statistical analytics into live sports coverage has fundamentally altered how matches are presented to audiences. Modern broadcasting now seamlessly integrates complex performance data into real-time commentary, creating a multi-layered viewing experience that satisfies both casual fans and tactical enthusiasts. This transformation represents a significant departure from the era when statistics were limited to basic metrics like possession percentages and shot counts.
Expected goals (xg) metrics revolutionise Goal-Scoring analysis
Expected Goals metrics have become perhaps the most influential analytical tool in modern football coverage, providing viewers with sophisticated insights into attacking performance that traditional statistics simply cannot deliver. xG calculations consider factors such as shot angle, distance from goal, body part used, and defensive pressure to assign probability values to scoring opportunities. This metric allows analysts to distinguish between teams that create high-quality chances and those that rely on volume shooting from poor positions.
During live broadcasts, expert analysts use xG data to challenge conventional narratives about match performance. A team might lead 2-0 on the scoreboard while registering a significantly lower xG than their opponents, indicating that clinical finishing rather than tactical dominance has determined the current state of play. This insight enables commentators to provide more nuanced predictions about potential second-half developments and helps viewers understand whether a result reflects sustainable performance patterns or temporary circumstances.
Player performance data integration through StatsBomb and opta sports
Leading data providers like StatsBomb and Opta Sports have revolutionised how individual player contributions are measured and presented during broadcasts. These platforms collect thousands of data points per match, tracking everything from progressive passes and defensive actions to spatial positioning and decision-making quality. Expert analysts leverage this wealth of information to provide detailed assessments of player performance that extend far beyond goals and assists.
The integration of this data allows commentators to highlight players who might otherwise go unnoticed by casual observers. A midfielder who completes 90% of their passes in the final third while maintaining high defensive intensity receives recognition for their contribution, even if they don’t appear on the traditional statistics sheet. This comprehensive approach to performance analysis ensures that tactical intelligence and work rate receive equal billing alongside more obvious attacking contributions.
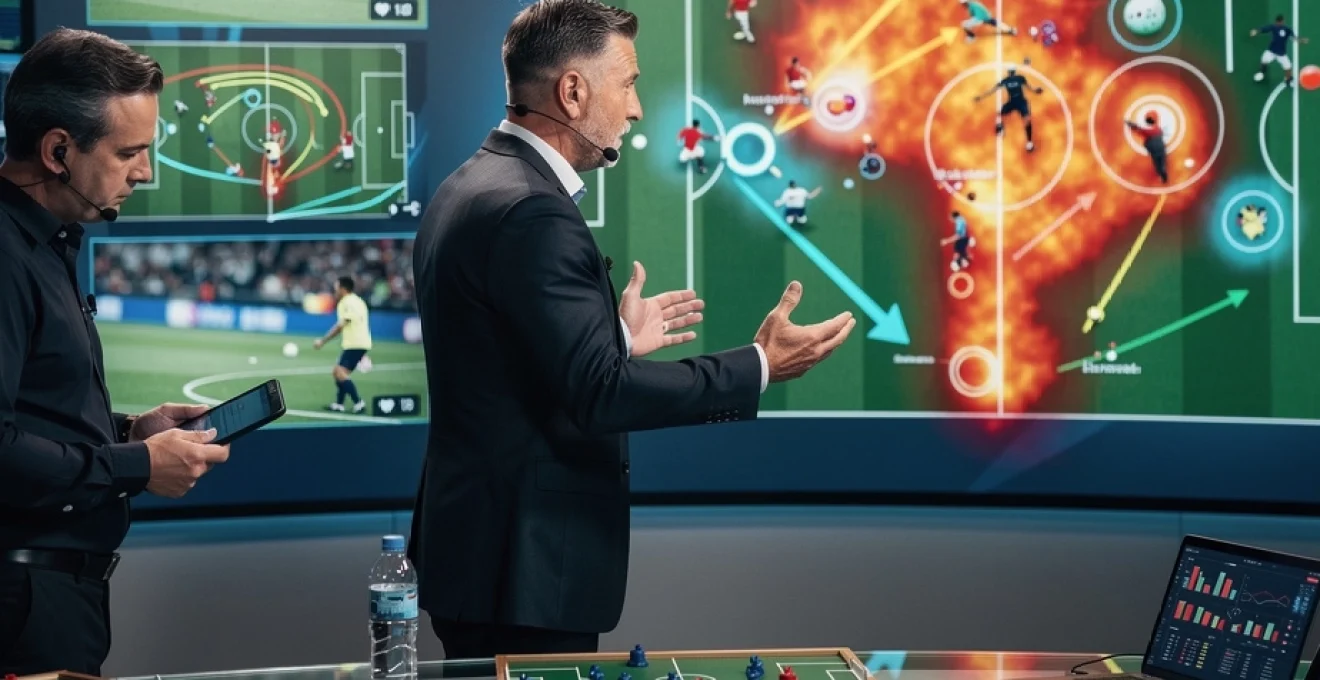
Heat maps and positional analytics enhance tactical breakdowns
Heat maps and positional analytics have transformed how tactical information is visualised and communicated to television audiences. These sophisticated graphics display player movement patterns throughout matches, revealing tactical adjustments, positional discipline, and strategic adaptation in real-time. Expert analysts use these visual tools to explain complex formation shifts and tactical nuances that would be impossible to convey through verbal description alone.
Modern broadcasting technology enables analysts to overlay multiple data visualisations onto live footage, creating compelling narratives about tactical evolution during matches. Viewers can observe how a team’s defensive line adjusts in response to opposition pressure, or how individual players modify their positioning based on match circumstances. This level of tactical insight elevates sports coverage from simple entertainment to educational content that enhances viewer understanding of professional sport’s strategic complexity.
Real-time performance indicators during live broadcasting
The development of real-time performance tracking has enabled broadcasters to present instantaneous analysis of emerging tactical trends during live coverage. Advanced algorithms process positional data from multiple cameras and sensors to generate immediate insights about pressing intensity, defensive compactness, and attacking tempo.
For example, broadcasters can now display live sprint distances, pressing actions, or high-intensity runs seconds after they occur, allowing expert commentators to connect physical output with tactical intent. Rather than waiting for post-match reports, viewers see momentum swings quantified as they happen: a drop in pressing intensity might explain why a team suddenly retreats into a lower block, while a spike in attacks down one flank can be traced to a targeted tactical adjustment. This immediate feedback loop deepens engagement and turns what used to be vague impressions into measurable, evidence-based insights for the audience.
Former professional athletes deliver tactical insights unavailable to general commentators
While numbers and dashboards provide the backbone of modern sports analytics, former professional athletes add irreplaceable context by translating data into on-pitch realities. They draw on lived experience of playing at elite level to interpret why certain tactical choices work, how players read situations in real time, and what subtle cues trigger specific movements. Their analysis often goes beyond what even the best-trained generalist commentator can offer because it is grounded in muscle memory, dressing-room knowledge, and first-hand exposure to high-pressure decision-making.
This does not mean that every ex-player automatically delivers world-class expert analysis. The most valuable voices are those who pair their career experience with preparation, video study, and an understanding of modern analytics. When this combination is in place, you get the kind of tactical breakdowns that have turned studio shows into must-watch content in their own right rather than just pre- and post-match filler.
Gary neville’s defensive shape analysis on monday night football
Gary Neville has become a benchmark for how ex-professionals can elevate sports coverage, particularly through his detailed deconstruction of defensive shape on Monday Night Football. Using telestrator tools and freeze-frames, he walks viewers through back-line movements frame by frame, highlighting how distances between defenders, body orientation, and timing of steps create either solidity or vulnerability. Rather than simply criticising a goal conceded, he shows the chain of positional errors that led to the chance in the first place.
What makes Neville’s expert analysis so valuable is his ability to connect theory with practice. He often relates situations to specific training drills, explaining how coaches structure sessions to rehearse dealing with cut-backs, defending the far post, or holding a high line. For viewers who want to understand why a team’s defensive record looks good in the data, or why an individual defender appears “out of form”, his commentary links those outcomes to the underlying defensive system and its execution in real time.
Thierry henry’s forward movement pattern breakdowns
Thierry Henry provides a complementary perspective from the attacking side, specialising in forward movement patterns and the micro-decisions that separate elite strikers from the rest. When breaking down goals or missed chances, he frequently pauses footage to highlight starting positions, blind-side runs, and body feints that create separation from defenders. To the untrained eye, these actions might look instinctive; Henry’s analysis reveals that they are often deliberate, rehearsed behaviours honed over years of competition.
By overlaying positional data and heat maps, Henry shows how a forward “reads” defensive lines, anticipates second balls, and manipulates space inside the box. This kind of expert sports analysis helps fans appreciate why some strikers consistently find themselves in high-value zones, as reflected in their xG per 90 minutes, even when they are not heavily involved in build-up play. For young players and coaches, these breakdowns double as masterclasses in off-the-ball movement and timing.
Jamie carragher’s Set-Piece defensive positioning commentary
Jamie Carragher has carved out a niche in explaining set-piece organisation, an area where marginal gains can decide titles and relegation battles. His commentary goes beyond noting that a team defends zonally or man-to-man; he dissects responsibilities for each zone, how blockers and screeners are deployed, and where mismatches occur. Using slow-motion replays and graphic overlays, he pinpoints how a single lost duel or mistimed step can undermine an entire set-piece structure.
Because set-pieces are easier to model statistically than open-play events, Carragher’s insights often sit naturally alongside modern metrics such as set-piece xG and goals conceded per set play. He helps viewers understand why some teams consistently outperform their expected set-piece numbers: not because of luck, but because of intelligent design, rehearsed routines, and clear communication. In doing so, he shows how granular tactical detail translates directly into measurable outcomes.
Roy keane’s midfield press recognition and Counter-Attacking analysis
Roy Keane’s on-air persona is often framed around intensity and standards, but his most valuable contributions lie in reading midfield pressing schemes and transitions. He quickly identifies when a team’s press is cohesive, with clear triggers and compact distances, versus when it is disjointed and easy to play through. By rewinding and replaying key sequences, he exposes how a late press from a forward or a passive midfielder can cause the entire structure to collapse.
Keane is also adept at explaining the link between successful pressing and dangerous counter-attacks. When a team wins the ball in advanced areas, he focuses on the first two or three passes and the supporting runs that determine whether the transition becomes a high-quality chance or fizzles out. This expert analysis of pressing intensity and counter-attacking patterns dovetails with live metrics on turnovers in the final third, progressive carries, and transition xG, giving viewers a complete picture of how modern midfield battles are won.
Specialised coaching credentials enable formation and system identification
Beyond ex-players, a growing number of broadcasters now feature pundits with formal coaching qualifications—often UEFA A or Pro Licences—who can decode formations and tactical systems with remarkable precision. These experts treat the game much like a chessboard, identifying structure and strategy before the casual viewer has even noticed that a team has shifted shape. Their analysis goes deeper than simply naming a formation; they explain functional roles, pressing schemes, and in-possession structures that change multiple times within a single match.
For instance, an experienced coach-analyst will highlight that a team listed as 4-3-3 on the line-up graphic actually builds in a 3-2-5, with a full-back inverting into midfield and wingers holding extreme width. They can explain how this supports overloads in central zones, or how rest-defence structures are set up to prevent counter-attacks. When you watch with this lens, sports coverage becomes less about static labels and more about dynamic systems, helping viewers understand why a coach has chosen a particular approach against a specific opponent.
These coaching voices also bring method to post-match expert analysis, using performance cycles and training principles to contextualise what we see on match day. They may note that a side experimenting with a new pressing system will naturally have teething problems, or that a team’s drop in intensity links to fixture congestion and periodisation rather than simple “lack of desire”. Such evidence-based commentary gives fans a more realistic framework for evaluating performances, reducing reliance on simplistic narratives.
Technology integration amplifies expert commentary through telestrator analysis
The most effective expert analysts are not just talented talkers; they are skilled users of technology that makes complex ideas easy to grasp. Telestrators, augmented reality graphics, and interactive dashboards turn the screen into a digital tactics board, allowing pundits to illustrate their points visually as they speak. This combination of visual cues and verbal explanation mirrors how coaches communicate with players in elite environments, making advanced tactical concepts accessible for a broad audience.
Think of telestrator analysis as the sports equivalent of annotated lecture slides. Rather than asking you to imagine spacing, passing lanes, or pressing angles, analysts draw them directly over the footage. Arrows, zones, and highlights guide your eye to the key details, while slow motion and zoom functions let the breakdown unfold at a pace suited to learning, not just entertainment. The result is sports coverage that feels closer to an interactive seminar than a one-way broadcast.
Sky sports’ interactive pitch graphics with tactical overlays
Sky Sports has been a pioneer in integrating interactive pitch graphics with live and post-match expert analysis. On shows such as Monday Night Football, analysts can reposition virtual players, draw passing lanes, and toggle between phases of play to simulate how different decisions might have changed an outcome. This goes far beyond simple replays: it becomes a form of tactical experimentation carried out in front of the audience.
These interactive overlays allow analysts to demonstrate concepts like compactness, overloads, and rotation patterns with exceptional clarity. For example, by sliding a virtual full-back five yards inside on the graphic, they can show how it would have closed a passing lane or created a numerical advantage in midfield. Viewers are not just told that a team was “too open” or “failed to support the press”; they see exactly how spacing and timing fell short in concrete, visual terms.
Espn’s film room technology for Multi-Angle breakdowns
ESPN’s “Film Room” and similar segments in other sports take inspiration from coaching environments, where staff pore over multi-angle footage to evaluate team performance. Analysts can switch between tactical camera views, behind-the-goal angles, and broadcast feeds to build a layered picture of each key moment. This mirrors how professional clubs integrate video analysis into their performance review process, bringing that level of sophistication into mainstream sports coverage.
By showing the same sequence from different angles, experts can highlight details that would otherwise remain hidden: a defensive line stepping up in unison, a midfielder scanning over their shoulder before receiving, or a winger signalling for a switch of play. In combination with timeline scrubbing and frame-by-frame playback, multi-angle breakdowns help viewers understand how small, almost invisible actions contribute to the overall tactical execution. For fans who want to learn “how to watch like a coach”, these film-room style segments are invaluable.
BT sport’s augmented reality player tracking systems
BT Sport and other broadcasters have increasingly adopted augmented reality (AR) player tracking systems that overlay live positioning data onto the pitch. These systems use computer vision to track every player and the ball, then display real-time information such as average positions, running lanes, and distances between units. When combined with expert commentary, AR graphics turn the broadcast into a living, breathing tactics board.
For example, an analyst might freeze play and use AR to emphasise the 20-metre gap between midfield and defence that an opponent exploits with line-breaking passes. Or they might highlight a team’s rest-defence structure, showing exactly how many players remain behind the ball when an attack is launched. This fusion of tracking technology and expert analysis helps viewers make sense of advanced concepts like vertical compactness or half-space occupation without needing to read academic coaching manuals.
Amazon prime’s X-Ray statistics integration during live streams
Amazon Prime’s X-Ray feature represents another step in integrating data-driven expert analysis directly into the viewing experience. During live streams, viewers can access contextual statistics, player profiles, and mini heat maps at the touch of a button, without leaving the match feed. This empowers fans to explore deeper layers of information in parallel with the commentary, rather than waiting for set-piece graphics or studio segments.
When used in tandem with expert pundits, X-Ray statistics help bridge the gap between what you hear and what you can verify yourself. If an analyst notes that a particular midfielder is dominating territory between the lines, you can quickly check their touches or progressive passes via X-Ray. This interactive dimension encourages more active, analytical viewing, turning fans into participants in the interpretive process rather than passive recipients of information.
Predictive analytics and Pre-Match intelligence shape strategic narrative
One of the most significant shifts in modern sports coverage is the move from descriptive commentary to predictive, intelligence-led analysis before a ball is even kicked. Using historical data, opposition scouting, and predictive models, expert analysts can outline likely tactical battles, key match-ups, and risk factors that will shape the game. In effect, they provide a roadmap that helps viewers understand not just what is happening, but whether events are unfolding as expected—or deviating from the underlying probabilities.
Predictive analytics in sports coverage often starts with simple questions: Which team will dominate territory? Where will pressing traps be set? Which players are most likely to generate high xG chances? By feeding years of tracking data, event data, and contextual factors such as rest days or injuries into machine learning models, broadcasters can present probabilities for outcomes like shot volumes, pressing intensity, or set-piece threat. Expert pundits then interpret these projections, explaining why certain patterns are likely and what coaches might do to exploit or mitigate them.
This pre-match intelligence also extends to opponent scouting. Analysts can show clips and dashboards illustrating how a side typically builds from the back, how their best scorer receives the ball, or where their defensive structure has been vulnerable over recent fixtures. For viewers, it’s akin to sitting in on the pre-game meeting at a professional club. When the match begins, you already know what to look for: if a team suddenly abandons its usual high press, or targets an unexpected flank, you can immediately sense that a strategic surprise is unfolding.
Post-match expert analysis drives social media engagement and viewership retention
The impact of expert analysis does not end with the final whistle; in many ways, that is when its influence is most visible. Post-match breakdowns have become some of the most shared and discussed content across social media platforms, often generating more conversation than the goals themselves. Clips of a pundit dissecting a controversial tactical call, or using video analysis to challenge a prevailing narrative, can rack up millions of views within hours and keep fans engaged long after the broadcast has ended.
From a broadcaster’s perspective, this extended lifecycle is crucial for viewership retention and brand visibility. Expert-led segments are easily repurposed into short-form videos, articles, and interactive graphics that circulate on Twitter, Instagram, and YouTube. Because they offer clear takeaways—why a high line failed, how a substitution changed the press, which player’s off-ball movement unlocked the defence—they invite debate and encourage fans to share their own interpretations. In effect, high-quality post-match analysis becomes a catalyst for community discussion.
There is also a feedback loop at play: as audiences grow more tactically literate through constant exposure to expert commentary and sports performance analysis, their expectations rise. Fans increasingly tune in not just for the live action, but for the promise of a detailed, data-informed debrief that will help them understand what they have just seen. Broadcasters who invest in skilled analysts, robust data partnerships, and advanced visual tools are better placed to meet this demand, ensuring that their coverage remains relevant in a sports media landscape where attention is the most valuable currency.